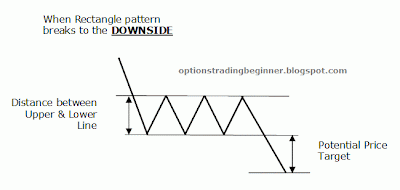
The breakout usually occurs in the same direction as the previous trend, although it may break against the previous trend as well.
Rectangle pattern is also known as “trading range”, “box pattern”, "rectangular pattern”, “consolidation zones”, or “congestion areas”.
The Formation of Rectangle Pattern


Rectangle Pattern contains at least two equal highs (peaks) and two equal lows (troughs). When the peak as well as trough points are connected by separate lines, they would form two parallel, horizontal lines that give the pattern its rectangle shape.
In this case, the horizontal upper line acts as resistance, whereas the horizontal lower line as support.
The pattern is completed when a break out occurs, i.e. when prices penetrate through either the upper line (i.e. breakout to the upside) or lower line (i.e. breakout to the downside) on expanding volume, and the trading range is broken as a result.
This pattern occurs because the price movement is contained by two parallel lines.
Rectangle pattern represent a trading range whereby the buyers’ and sellers’ strengths are near equilibrium.
As prices near the support (upper line), the buyers (bulls) step in and drive the prices higher.
In turn, as prices near the resistance (lower line), the sellers (bears) take over and push the prices lower.
In the end, either the buyers or sellers managed to find enough conviction to break out to one side with great force.
Continue to Part 2: Important Characteristics of Rectangle pattern.
To read about other chart patterns, go to: Learning Charts Patterns.
Related Posts:
* FREE Trading Educational Videos You Must Not Miss
* Learning Candlestick Charts
* Options Trading Basic – Part 2
* Understanding Implied Volatility (IV)
* Option Greeks


0 comments:
Post a Comment