OPTIONS

Showing posts with label Technical Analysis. Show all posts

Sunday, October 10, 2010

Thursday, September 23, 2010

THREE BLACK CROWS - Bearish Candlestick Pattern


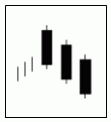
Three Black Crows (Bearish)

Three Black Crows is a top reversal / bearish reversal formation.
It could occur at the end of an uptrend, or during a bounce within a downtrend, or at the resistance.

This pattern consists of 3 consecutive long black candlesticks that appear in an upward price trend.
The opening price of Candles 2 and 3 of the pattern should be higher than the previous day's closing price (i.e. The prices open within the previous day’s body).
And all the 3 candles should close near or at their lows, and make new lows in each day.

Since all the 3 candles should close near or at their lows, the lower shadows of the Three Black Crows formation are normally short, or even no shadow in some cases.

This pattern is formed when the prices are in overbought condition, and indicate a sign that the bulls might have lack of conviction in the current uptrend. This uptrend has now reached levels where the bears have started to short the market.
On 1st day, due to increasing selling pressure, the price closes below its opening price.
On 2nd and 3rd days, it seems that as if the price wants to regain its former strength, as the price opens higher than the previous day’s close. However, by the end of each day, the sellers would regain control, causing the price to fall to a new closing low (i.e. the price closes at lower levels than previous day’s closing price).

The Three Black Crows pattern does not occur very frequently. However, when it does occur, traders / investors should be very alert, because their appearance indicates a period of strong selling pressure, and hence the reliability of this pattern is likely to be very high. If on the 4th day the stock is not able to show strength, then lower prices may potentially continue.

The reliability of this pattern tends to increase in the following conditions:
1) Longer black candlesticks’ body.
However, it should not be too long as well because if the black candlesticks are too long (over-extended), traders / investors would worry that the market could be oversold by now and hence may pause accordingly.
2) Shorter lower shadow of the candles.
3) The opening prices of the 2nd and 3rd days can be anywhere within the previous day's body. However, it is better to see the opening prices to be below the middle of the previous day's body.
4) Increase in trading volume.

Although the reliability of this pattern is likely to be very high, but it is always better to substantiate this signal with other technical indicators to confirm that the momentum is actually changing.

Analysis Tool:
Get Free Trend Analysis for your favorite symbols

Other Learning Resources:
* FREE Trading Educational Videos with Special Feature
* FREE Trading Educational Videos from Trading Experts

Related Posts:
* Learning Candlestick Charts
* Learning Charts Patterns
* Options Trading Basic – Part 1
* Options Trading Basic – Part 2
* Understanding Implied Volatility (IV)
* Option Greeks

Monday, July 26, 2010

Market Analysis Video: Intense Bull vs Bear Battle in the Current S&P Market

The battle between the bulls and the bears continues in the S&P 500 with neither side able to gain the upper hand. This choppy trading action will eventually lead to a large move one way or the other. The bulls are betting that we are headed higher and the bears are betting that the economy is going to tank.

This new video shares some of the key technical points that are still in play and where the market needs to go in order to break out of the current logjam that it's in.

Other Learning Resources:
* FREE Trading Educational Videos with Special Feature
* FREE Trading Educational Videos: Learn Technical Analysis from Award Winning Author John Murphy

Related Topics:

* Options Trading Basic – Part 1
* Options Trading Basic – Part 2
* Understanding Implied Volatility (IV)
* Option Greeks
* Understanding Option’s Time Value
* Learning Charts Patterns
* Learning Candlestick Charts
* Getting Started Trading

Monday, July 12, 2010

THREE WHITE SOLDIERS - Bullish Candlestick Pattern


Three White Soldiers is a 3-day bottom reversal / bullish reversal formation.
It could occur at the end of a downtrend, or during a pullback within an uptrend, or at the support.

The appearance of Three White Soldiers pattern signals that higher prices are likely ahead.
This pattern is more powerful particularly when it appears after an extended decline followed by sideways movement.

Three White Soldiers pattern consists of 3 consecutive long white candlesticks that occur during a downward price trend.
The opening price of Candles 2 and 3 of the pattern should be lower than the previous day's closing price (i.e. The prices open within the previous day’s body).
And all the 3 candles should close near or at their highs, and make new highs in each day.

Since all the 3 candles should close near or at their highs, the upper shadows of the Three White Soldiers formation are normally short, or even no shadow in some cases.

This pattern is formed when the prices are in oversold condition, and indicate a sign that the bears might have lack of conviction in the current downtrend.
On 1st day, due to increasing buying pressure, the price closes above its opening price.
On 2nd and 3rd days, it seems that as if the bears want to regain controls, as the price opens lower than the previous day’s close. However, by the end of each day, the buyers’ strength overcomes the earlier bears, causing the price to move up to a new closing high (i.e. the price closes at higher levels than the previous day’s closing price).

The Three White Soldiers pattern does not occur very frequently. However, when it does occur, traders / investors should be very alert, because their appearance indicates a period of strong buying pressure, and hence the reliability of this pattern is likely to be very high.

The reliability of this pattern tends to increase in the following conditions:
1) Longer white candlesticks’ body.
However, it should not be too long as well because if the white candlesticks are too long (over-extended), traders / investors would worry that the market could be overbought by now and hence may pause accordingly.
2) Shorter upper shadow of the candles.
3) The opening prices of the 2nd and 3rd days can be anywhere within the previous day's body. However, it is better to see the opening prices to be above the middle of the previous day's body. The higher a candle opens compared to the prior candle, the stronger the chance of a continued reversal.
4) Increase in trading volume.

Although the reliability of this pattern is likely to be very high, but it is always better to substantiate this signal with other technical indicators to confirm that the momentum is actually changing.

To learn about other major candlestick patterns, please refer to the following:
Learning Candlestick Charts

Other Learning Resources:
* FREE Trading Educational Videos with Special Feature
* FREE Trading Educational Videos: Learn Technical Analysis from Award Winning Author John Murphy

Related Topics:
* Options Trading Basic – Part 1
* Options Trading Basic – Part 2
* Understanding Implied Volatility (IV)
* Option Greeks
* Understanding Option’s Time Value
* Learning Charts Patterns
* Getting Started Trading

Tuesday, July 6, 2010

Friday, July 2, 2010

Trading Educational Video: BEARISH ENGULFING Candlestick Pattern

Japanese Candlestick patterns have been popular and widely used by traders. There are several major Candlestick Patterns which most technical traders should be familiar with, such as: Bullish vs. Bearish Engulfing, Harami Bullish vs. Bearish, Piercing Line vs. Dark Cloud Cover, Hammer vs. Hanging Man, Inverted Hammer vs. Shooting Star, etc.

This video shows the real current example for BEARISH ENGULFING Candlestick Pattern in the Nasdaq market. Do watch it to see the more detail analysis and why you should pay attention to this pattern when it appears in the chart.

You may want to read this previous article to find out more about Bullish & Bearish Engulfing Candlestick Pattern.

To learn about other Japanese Candlestick pattern, please refer to the following:
Learning Candlestick Charts

Other Learning Resources:
* FREE Trading Educational Videos with Special Feature
* FREE Trading Educational Videos: Learn Technical Analysis from Award Winning Author John Murphy

Related Topics:
* Learning Charts Patterns
* Options Trading Basic – Part 1
* Options Trading Basic – Part 2
* Option Greeks
* Understanding Implied Volatility (IV)
* Understanding Option’s Time Value

Monday, June 28, 2010

Trading Educational Video: How To Use FIBONACCI RETRACEMENT and MARKET DIVERGENCE in Your Trading

Some of the powerful tools in the technical analysis which many traders use to help them in their trading are Fibonacci Retracement and Market Divergences.

How to make use of these two powerful tools in your trading?
The following are two videos that discuss and explain in very detail about how to use Fibonacci Retracement and Market Divergence to help in your trading analysis.

* Fibonacci Retracements Explained
* Market divergences Explained

I believe the explanation in the videos will be very useful & educational, along with the real examples from the current markets.
Happy learning!

Other Learning Resources:
* FREE Trading Educational Videos with Special Feature
* FREE Trading Educational Videos: Learn Technical Analysis from Award Winning Author John Murphy

Related Topics:
* Options Trading Basic – Part 1
* Options Trading Basic – Part 2
* Understanding Implied Volatility (IV)
* Option Greeks
* Understanding Option’s Time Value
* Learning Candlestick Charts
* Learning Charts Patterns
* Getting Started Trading

Sunday, June 6, 2010

HEAD AND SHOULDERS BOTTOM PATTERN – Part 2: Important Characteristics

Go back to Part 1: Head & Shoulders Bottom Formation

Important Characteristics of Head & Shoulders Bottom Pattern

Existing Trend:
There should be an established existing DOWNWARD trend prior to the pattern.

Shape of Head & Shoulders Bottom Pattern:
1) Head & Shoulders:
Ideally, the shape Head & Shoulders should be symmetry. The Left & Right Shoulders should bottom at about the same price level. The Left & Right Shoulders should also about the same distance from the Head, which means the time duration to develop the formation between the bottom of Left Shoulder & the Head should be about the same as that between the Head & the bottom of Right Shoulder.

However, in the real world, the Shoulders are rarely perfectly symmetrical. Sometimes, one shoulder is lower than the other, or takes longer time to develop.
In any case, the Left or Right Shoulder should not reach the level of the Head. If it does, the formation is actually not Head & Shoulders Bottom pattern.

When the bottom of the Right Shoulder is higher than the bottom of the Left Shoulder, it may carry a higher chance of larger price increase after the breakout, as it implies more strength & bullish sentiments.

In addition, ideally, the shape Head & Shoulders should also be made up of three downward sharp bottoms. But in real world, the Shoulders can be a bit more rounded / flat.
Also, sometimes in a more complex formation, the pattern could have more than one head and/or more than two shoulders (e.g. 2 Left Shoulders with about the same size and 2 Right Shoulders that are more or less equivalent to the Left Shoulders). This more complex formation is more often seen in the Head & Shoulders Bottom than in the Head & Shoulders Top.

2) Neckline:
The Neckline that connects the two high points in between the Left Shoulder-Head and the Head-Right Shoulder can be horizontal, sloping upwards or downwards, but should not be too steep.
The slope of the Neckline could predict degree of bullishness of the pattern and hence affect the chance of stronger price increase.

A downwards sloping Neckline has a weaker tendency that the price would increase further, as the lower high of the 2nd low point of the Neckline still indicates the strength of bearishness & market weakness, and thus it carries lower chance of stronger price increase.

An upwards sloping Neckline, which rarely happens, is more reliable as a bullish reversal signal, as it may imply stronger bullish sentiments & more rapidly increasing market strength, and hence have a higher chance of stronger price increase.

Duration:
The duration of the formation of the pattern from the start of the development of Left Shoulder to the break of the Neckline can take several months, normally range from 3 to 6 months.
Normally, Head & Shoulders Bottom takes longer time to develop and less volatile in price swing than Head & Shoulders Top.
Hence, bottoms tend to be wider (due to longer duration to develop) and flatter (as a result of less volatile price swing) than tops.

Breakout:
Even when the price has increased from bottom of the Right Shoulder, the pattern is not completed yet. The chances that the existing downtrend will continue are still higher than the chances of reversal to take place, as it is normal during a downtrend for the price to test a support level a few times, and then bounce up, and then resume the downtrend again.

Head & Shoulders Bottom pattern is only completed and confirmed when the price increases and closes above the Neckline, which serves as the key resistance level in this pattern.

Remember that we should always assume the existing trend (i.e. in this case is downtrend) is in force unless proven otherwise.
Therefore, it is important to wait for the price to make a decisive breakout by breaking through and closing above the Neckline resistance, accompanied with an increase in volume, in order to avoid jumping the gun and/or prevent deceptive Head & Shoulders Bottom pattern.

Nevertheless, since this pattern is considered as one of the most reliable pattern and has a relatively high success rate, some aggressive & experienced traders like to enter the market when the price is increasing from the bottom of the Right Shoulder, provided they are sure that a valid Head & Shoulders Bottom is forming. But of course, this trade is much riskier and not recommended for novice traders.

Breakout Confirmation:
Sometimes, the price may also make a deceptive/invalid breakout whereby it touches above the Neckline, but then it moves back down again & resumes downtrend.
One possible way to prevent this is by having certain criteria to confirm if the breakout is a valid one.

A minimum penetration criteria for a breakout should be the price closes ABOVE the Neckline resistance, not just an intraday penetration.
Some traders may apply certain price criteria (e.g. 3% - 5% break from the Neckline depending on the stock’s volatility) or time criteria (e.g. the breakout is sustained for 3 days) to confirm the validity of the breakout.

Traders / investors should be more cautious if the price keeps hovering around the Neckline without making a decisive break. When this happens, the reversal might never happen and the downtrend is likely to resume.

Volume:
Volume should be diminishing as the pattern is forming.
Volume is the highest during the formation of the Left Shoulder, and then gets lighter as the pattern develops the Head, and should be the lightest during the formation of Right Shoulder, showing an indication that the selling sentiments are getting weaker.
During & after the breakout of the Neckline support, the volume should significantly increase again.

Monitoring volume for Head & Shoulders Bottom is more crucial than in Head & Shoulders Top, as a breakout from the key resistance (i.e. Neckline) accompanied by an expansion in volume may indicate increased buying pressures and a potential change in sentiment from selling to buying. Hence, it may provide higher chances that the pattern is a reversal pattern.

When during the increase from bottom of the Right Shoulder, the price experiences an accelerated increase, perhaps with a gap up or two, accompanied by an expansion in volume, this might give a good sign, as the price increase tends to increase further, and hence it may provide higher chances that the pattern is a bullish reversal pattern.

Potential Price Target:
1) Compute the height of the pattern: The vertical distance between the bottom of the Head (which serves as the support) and the Neckline (which serves as the key resistance).
2) To compute the potential price target: Add the result to the point where the price finally breaks Neckline.

In general, any price target should only be used as a rough guide. To determine the price target, other factors, such as previous support / resistance levels, Fibonacci retracements, or long-term moving averages, should be considered as well.

Example:
Suppose a Head & Shoulders Bottom pattern is forming with the Neckline is sloping upward.
The bottom of the Head is at $50 and the Neckline vertically above it is at $65.
The height of the pattern is therefore 15 (= 65 - 50).
Suppose the Neckline was finally broken at $70.
Hence, the price target would be $85 (= 70 + 15).

Return to Breakout Level:
After the breakout occurs, the price may sometimes return to the Neckline for an immediate test of this new support level before continuing their moves in the direction of the breakout. (Remember that the resistance now has turned into new support level). It is also normally only a minor & short-lived retracement.
If this price return move happens, it could actually offer an opportunity to participate in the breakout with a better reward to risk ratio.
However, when the breakout occurs with a heavy volume, the chance of the price to return to the breakout level before continuing its upward movement will be smaller.

To find out more about other Chart Patterns, please refer to:
Learning Charts Patterns

Analysis Tool:
Get Free Trend Analysis for your favorite symbols

Other Learning Resources:
* FREE Trading Educational Videos with Special Feature
* FREE Trading Educational Videos: Learn Technical Analysis from Award Winning Author John Murphy

Related Topics:
* Learning Candlestick Charts
* Options Trading Basic – Part 1
* Options Trading Basic – Part 2
* Understanding Option Greek
* Understanding Implied Volatility (IV)
* Understanding Option’s Time Value

Saturday, May 22, 2010

HEAD AND SHOULDERS BOTTOM PATTERN – Part 1: Formation

Head & Shoulders Bottom Pattern is a bullish reversal pattern that normally forms after an extended downtrend, which marks a shift in trend from bearish to bullish. This pattern is very popular because it is regarded as one of the most reliable of all patterns.
Head and Shoulders Bottom pattern is sometimes referred to as Inverse Head and Shoulders pattern.

The Formation of Head and Shoulders Bottom Pattern


Head and Shoulders Bottom Pattern contains three consecutive, sharp bottoms, whereby the middle bottom is the lowest (Head) and the other two bottoms (left & right bottoms) are higher & roughly equal in size (Left & Right Shoulders).

This pattern forms when the price is in an existing downtrend. The price falls and hits a low then bounce up (forming the Left Shoulder). Afterwards, the price falls to an even lower low and then bounces up again (forming the Head). The Right Shoulder is formed when the price drops again but it does not reach the low of the Head. Instead, the price bounces back up after it has hit about the same price level as the Left Shoulder.
Although the Left & Right Shoulders do not necessarily need to be exactly the same, but it should appear roughly equal to one another.

The important part of this pattern is the Neckline. The Neckline is formed by drawing a line that connects two high points: (1) the high point in between the Left Shoulder & Head, and (2) the high point in between the Head & Right Shoulder.
This Neckline can be horizontal, sloping upwards or downwards.

The pattern is only completed and confirmed when the price increases and closes above the Neckline, which serves as the key resistance level in this pattern.

Although Head & Shoulders Bottom is viewed as a common pattern and quite easy to identify, it’s actually not the case. Therefore, one should pay close attention & take proper steps to analyze the characteristics of Head & Shoulders Bottom in order to minimize / avoid making mistakes in spotting the pattern.
The characteristics of the pattern will be discussed in more detail in the next post.

To be continued to Part 2: Important Characteristics of Head & Shoulders Bottom pattern.

To find out more about other Chart Patterns, please refer to:
Learning Charts Patterns

Analysis Tool:
Get Free Trend Analysis for your favorite symbols

Related Topics:
* Learning Candlestick Charts
* Options Trading Basic – Part 1
* Options Trading Basic – Part 2
* Understanding Option Greek
* Understanding Implied Volatility (IV)
* Understanding Option’s Time Value

Sunday, May 9, 2010

Market Analysis Video: Bearish View on Dow and S&P markets

Watch the following videos for an update on Dow and S&P markets:
* Dow market analysis
* S&P market analysis

In the videos, you’ll again see the “power” of Fibonacci tools, along with MACD Divergence analysis. Happy watching! :)

Other Free Trading Videos for Learning Resources:
FREE Trading Educational Videos with Special Feature

Analysis Tool:
Get Free Trend Analysis for your favorite symbols

Saturday, April 17, 2010

HEAD AND SHOULDERS TOP PATTERN – Part 2: Important Characteristics

Go back to Part 1: Head & Shoulders Top Formation

Important Characteristics of Head & Shoulders Top Pattern:

Existing Trend:
There should be an established existing UPWARD trend prior to the pattern.

Shape of Head & Shoulders Top Pattern:
1) Head & Shoulders:
Ideally, the shape Head & Shoulders should be symmetry. The Left & Right Shoulders should peak at about the same price level. The Left & Right Shoulders should also about the same distance from the Head, which means the time duration to develop the formation between the top of Left Shoulder & the Head should be about the same as that between the Head & the top of Right Shoulder.

However, in the real world, the Shoulders are rarely perfectly symmetrical. Sometimes, one shoulder is higher than the other, or takes longer time to develop.
In any case, the Left or Right Shoulder should not reach the level of the Head. If it does, the formation is actually not Head & Shoulders Top pattern.

When the peak of the Right Shoulder is lower than the peak of the Left Shoulder, it may carry a higher chance of larger price decline after the breakout, as it implies more weakness & bearish sentiments.

In addition, ideally, the shape Head & Shoulders should also be made up of three upward sharp peaks. But in real world, the Shoulders can be a bit more rounded / flat.
Also, sometimes in a more complex formation, the pattern could have more than one head and/or more than two shoulders (e.g. 2 Left Shoulders with about the same size and 2 Right Shoulders that are more or less equivalent to the Left Shoulders). Nevertheless, a more complex formation is more often seen in the Head & Shoulders Bottom than in the Head & Shoulders Top.

2) Neckline:
The Neckline that connects the two low points in between the Left Shoulder-Head and the Head-Right Shoulder can be horizontal, sloping upwards or downwards.
The slope of the Neckline could predict degree of bearishness of the pattern and hence affect the chance of severe price decline.

An upwards sloping Neckline has a weaker tendency that the price will decline further, as the higher low of the 2nd low point of the Neckline still indicates the strength of bullishness, and thus it carries lower chance of severe price decline.

A downwards sloping Neckline, which rarely happens, is more reliable as a bearish reversal signal, as it may imply stronger bearish sentiments & more rapidly increasing weakness, and hence have a higher chance of severe price decline.

Duration:
The duration of the formation of the pattern from the start of the development of Left Shoulder to the break of the Neckline can take several months, normally range from 3 to 6 months.

Breakout:
Even when the price has declined from peak of the Right Shoulder, the pattern is not completed yet. The chances that the existing uptrend will continue are still higher than the chances of reversal to take place, as it is normal during an uptrend for the price to test a resistance level a few times, then retreat, and then resume the uptrend again.

Head & Shoulders Top pattern is only completed and confirmed when the price declines and closes below the Neckline, which serves as the key support level in this pattern.

Remember that we should always assume the existing trend (i.e. in this case is uptrend) is in force unless proven otherwise.
Therefore, it is important to wait for the price to make a decisive breakout by breaking through and closing below the Neckline support, preferably accompanied with an increase in volume, in order to avoid jumping the gun and/or prevent deceptive Head & Shoulders Top pattern.

Nevertheless, since this pattern is considered as one of the most reliable pattern and has a relatively high success rate, some aggressive & experienced traders like to enter the market when the price is declining from the peak of the Right Shoulder, provided they are sure that a valid Head & Shoulders Top is forming. But of course, this trade is much riskier and not recommended for novice traders.

Breakout Confirmation:
Sometimes, the price may also make a deceptive/invalid breakout whereby it touches below the Neckline, but then it moves back up again & resumes uptrend.
One possible way to prevent this is by having certain criteria to confirm if the breakout is a valid one.

A minimum penetration criteria for a breakout should be the price closes BELOW the Neckline support, not just an intraday penetration.
Some traders may apply certain price criteria (e.g. 3% - 5% break from the Neckline depending on the stock’s volatility) or time criteria (e.g. the breakout is sustained for 3 days) to confirm the validity of the breakout.

Traders / investors should be more cautious if the price keeps hovering around the Neckline without making a decisive break. When this happens, the reversal might never happen and the uptrend is likely to resume.

Volume:
Volume should be diminishing as the pattern is forming.
Volume is the highest during the formation of the Left Shoulder, and then gets lighter as the pattern develops the Head, and should be the lightest during the formation of Right Shoulder, showing an indication that the buying pressures are getting weaker.
Ideally, during & after the breakout of the Neckline support, the volume should significantly increase again.
When during the decline from peak of the Right Shoulder, the price experiences an accelerated drop, perhaps with a gap down or two, accompanied by an expansion in volume, this might give a good sign, as the price decline tends to drop further, and hence it may provide higher chances that the pattern is a bearish reversal pattern.

Potential Price Target:
1) Compute the height of the pattern: The vertical distance between the top / peak of the Head (which serves as the resistance) and the Neckline (which serves as the key support).
2) To compute the potential price target: Subtract the result from the point where the price finally breaks Neckline.

In general, any price target should only be used as a rough guide. To determine the price target, other factors, such as previous support / resistance levels, Fibonacci retracements, or long-term moving averages, should be considered as well.

Example:
Suppose a Head & Shoulders Top pattern is forming with the Neckline is sloping downward.
The peak of the Head is at $80 and the Neckline vertically under it is at $60.
The height of the pattern is therefore 20 (80 - 60 = 20).
Suppose the Neckline was finally broken at $50.
Hence, the price target would be $30 (50 - 20 = 30).

Return to Breakout Level:
After the breakout occurs, the price may sometimes return to the Neckline for an immediate test of this new resistance level before continuing their moves in the direction of the breakout. (Remember that the support now has turned into new resistance level). It is also normally only a minor & short-lived bounce.
If this price return move happens, it could actually offer an opportunity to participate in the breakout with a better reward to risk ratio.
However, when the breakout occurs with a heavy volume, the chance of the price to return to the breakout level before continuing its downward movement will be smaller.

To find out more about other Chart Patterns, please refer to:
Learning Charts Patterns

Analysis Tool:
Get Free Trend Analysis for your favorite symbols

Related Topics:
* Learning Candlestick Charts
* Options Trading Basic – Part 1
* Options Trading Basic – Part 2
* Understanding Option Greek
* Understanding Implied Volatility (IV)
* Understanding Option’s Time Value

Saturday, March 27, 2010

HEAD AND SHOULDERS TOP PATTERN – Part 1: Formation

Head and Shoulders Top is a bearish reversal pattern that normally forms after an extended uptrend, which marks a shift in trend from bullish to bearish. This pattern is very popular because it is regarded as one of the most reliable of all patterns.

The Formation of Head & Shoulders Top Pattern


Head and Shoulders Top Pattern contains three consecutive, sharp peaks / tops, whereby the middle peak is the highest (Head) and the other two peaks (left & right peaks) are lower & roughly equal in size (Left & Right Shoulders).

This pattern forms when the price is in an existing uptrend. The price increases and hits a high then declines (forming the Left Shoulder). Afterwards, the price increases to an even higher high and then declines again (forming the Head). The Right Shoulder is formed when the price rises again but it does not hit the high of the Head. Instead, the price falls back after it has reached about the same price level as the Left Shoulder.
Although the Left & Right Shoulders do not necessarily need to be exactly the same, but it should appear roughly equal to one another.

The important part of this pattern is the Neckline. The Neckline is formed by drawing a line that connects two low points: (1) the low point in between the Left Shoulder & Head, and (2) the low point in between the Head & Right Shoulder.
This Neckline can be horizontal, sloping upwards or downwards.

The pattern is only completed and confirmed when the price decreases and closes below the Neckline, which serves as the key support level in this pattern.

Although Head & Shoulders Top is viewed as a common pattern and quite easy to identify, it’s actually not the case. Therefore, one should pay close attention & take proper steps to analyze the characteristics of Head & Shoulders Top in order to minimize / avoid making mistakes in spotting the pattern.
The characteristics of the pattern will be discussed in more detail in the next post.

Continue to Part 2: Important Characteristics of Head & Shoulders Top pattern.

To find out more about other Chart Patterns, please refer to:
Learning Charts Patterns

Related Topics:
* 10 Important Trading Lessons
* Learning Candlestick Charts
* Options Trading Basic – Part 1
* Options Trading Basic – Part 2
* Understanding Option Greek
* Understanding Implied Volatility (IV)
* Understanding Option’s Time Value

Analysis Tool:
Get Free Trend Analysis for your favorite symbols

Friday, March 5, 2010

A Technical Video Analysis of the Equity Market

Although all the indices are undergoing some correction recently, the major trend for all the indices still remains positive. However, the trend may potentially reverse to negative in these markets should the key reversal price levels are broken.

This new short video will show you an analysis of where the key reversal area is in the S&P 500, the NASDAQ, and the Dow, if in fact the markets are ever going to reverse to the downside.

Saturday, January 30, 2010

10 Important Trading Lessons

I got to know that there is a series of free trading lessons, which consists of 10 topics that traders, both beginners and experienced traders should find them very useful.
While for more experienced traders, they could serve as a refresher, I think these trading lessons are particularly even more important for beginners.

The 10 Free Trading Lessons will cover the following topics:

(1) The importance of psychology in price movement.

(2) How to spot mega trends.

(3) Understanding of technical price objectives.

(4) How to picture price objectives.

(5) How to trade with moving averages.

(6) How to use point and figure trading techniques.

(7) How to use the RSI indicator.

(8) How to correctly use stochastics in your trading.

(9) How to use the ADX indicator to capture trends.

(10) How to capitalize on natural market cycles.

On top of the above, you will learn all about Fibonacci retracements, MACD, Bollinger Bands, and much more.

These 10 free trading lessons will be sent via email.
In order to get this, just fill out the form here. Then you should be able to get it started very soon.
Hope this info can be useful to you. :)

Saturday, December 12, 2009

Market Analysis Video: Is S&P 500 Getting Ready to Skyrocket or Collapse?

The market has been moving sideways recently, developing a Rectangle pattern.
Is S&P 500 market getting ready to skyrocket or collapse?
What are the key price levels to watch this week?
Find out more detail in this video for the S&P 500 market updates.

Sorry, it’s been some time since I posted an update on the market analysis.
I was quite held up with things lately. However, when I saw this video, I can’t wait to share it with you. Not only is it informative, but also educational for both experienced & beginner traders. Happy watching! :)

Related Topics:
* Free Trading Educational Video: Learn Technical Tips from Dan Gramza
* Learning Candlestick Charts
* Learning Charts Patterns
* Understanding Implied Volatility (IV)
* Understanding Option Greeks
* Understanding Option’s Time Value

Analysis Tool:
Get Free Trend Analysis for your favorite symbols

Saturday, November 14, 2009

TRIPLE BOTTOM PATTERN – Part 2: Important Characteristics

Re-visit Part 1: Triple Bottom Formation

Important Characteristics of Triple Bottom Pattern

Existing Trend:
There should be an established existing DOWNWARD trend prior to the pattern.

Shape of Triple Bottom Pattern:
1) The Three Bottoms:
The bottoms should be sharp and distinct / well separated. The price bottoms do not have to be exactly the same, but it should appear reasonably equivalent to each other.
If the last bottom (3rd bottom) is higher than the middle bottom (2nd bottom), there is a relatively higher chance of stronger price increase. A higher bottom in the last bottom might indicate weaker selling pressures, as the sellers attempt to push the price down to the previous low or make a new low but fail, suggesting that the selling pressures might have started to subside.

2) The Two Peaks:
The highs of the peaks can appear more rounded.

Duration:
Triple Bottoms pattern can be considered a long term pattern.
The duration of the formation of the pattern can take several months, normally range from 3 to 6 months, with an average of about 4 months. Normally, the formation of Triple Bottoms should take longer time and less volatile in price swing than Triple Tops. Hence, bottoms tend to be wider (due to longer duration to develop) and flatter (as a result of less volatile price swing) than tops.
Basically, the longer the time duration the pattern takes to develop, the more likely the pattern could work out as a reversal pattern or the stronger the price might move once the breakout occurs.

Breakout:
Even when the price has risen from the 3rd bottom, the pattern is not completed yet. The chances that the existing downtrend will continue are still higher than the chances of reversal to take place, as it is normal during a downtrend for the price to test a support level a few times, and then bounce up, and then resume the downtrend again.

Triple Bottom pattern is only completed and confirmed when the price increases and closes above the highest highs of the peaks in between the 3 bottoms, which serves as the key resistance level in this pattern. This highest high is called the “Confirmation Point”.

Remember that we should always assume the existing trend (i.e. in this case is downtrend) is in force unless proven otherwise.
Therefore, it is important to wait for the price to make a decisive breakout by breaking through and closing above the Confirmation Point, accompanied with an increase in volume, in order to avoid jumping the gun and/or prevent deceptive Triple Bottoms pattern.

In addition, as Triple Bottoms is forming, the formation may also resemble few other patterns. Before the 3rd bottom is formed, the pattern may look like Double Bottoms (reversal pattern). The three equal lows may also be seen in Rectangle pattern (neutral pattern) or Descending Triangle pattern (bearish continuation pattern).
Nevertheless, all these patterns have similar principle to follow, which could help differentiate between the above patterns or avoid jumping the gun: Always wait for the decisive breakout to occur before entering into any trade.

Breakout Confirmation:
Sometimes, the price may also make a deceptive/invalid breakout whereby it touches above the Confirmation Point, but then it moves back down again & resumes downtrend.
One possible way to prevent this is by having certain criteria to confirm if the breakout is a valid one.
A minimum penetration criteria for a breakout should be the price closes ABOVE the Confirmation Point, not just an intraday penetration.
Some traders may apply certain price criteria (e.g. 3% - 5% break from the Confirmation Point depending on the stock’s volatility) or time criteria (e.g. the breakout is sustained for 3 days) to confirm the validity of the breakout.

Volume:
Volume should be higher during the formation of the 1st bottom and then get lighter as the pattern develops the subsequent two bottoms, showing an indication that the selling pressures are getting weaker.
The volume may sometimes pick up when the price hits each of the bottoms, but overall, volume tends to be diminishing as the pattern is forming.
During & after the breakout of the Confirmation Point, the volume should significantly increase again.
When during the increase from the 3rd bottom, the price experiences an accelerated rise, perhaps with a gap up or two, accompanied by an expansion in volume, this might give a good sign, as the price increase tends to rise further, and hence it may provide higher chances that the pattern is bullish reversal pattern.

Potential Price Target:
1) Compute the height of the pattern: The distance between the lowest low of bottoms (which serves as the support) and the highest high of the peaks (i.e. the Confirmation Point, which serves as the key resistance).
2) To compute the potential price target: Add the result to the Confirmation Point (i.e. the highest high of the peaks).

In general, any price target should only be used as a rough guide. To determine the price target, other factors, such as previous support / resistance levels, Fibonacci retracements, or long-term moving averages, should be considered as well.

Return to Breakout Level:
After the breakout occurs, it is common that prices may return to the breakout level for an immediate test of this new support level before continuing their moves in the direction of the breakout. (Remember that the resistance now has become a new support level).
This could actually offer an opportunity to participate in the breakout with a better reward to risk ratio.

To find out more about other Chart Patterns, please refer to:
Learning Charts Patterns

Related Topics:
* Free Trading Educational Video: Learn Technical Tips from Dan Gramza
* Learning Candlestick Charts
* Options Trading Basic – Part 1
* Options Trading Basic – Part 2
* Understanding Option Greek
* Understanding Implied Volatility (IV)
* Understanding Option’s Time Value

Analysis Tool:
Get Free Trend Analysis for your favorite symbols

Wednesday, November 4, 2009

Market Analysis Video: Has the S&P Index Broken Final Support?

In the previous video on the S&P 500 last week, it was indicated that this market may have topped out for the year.
As a follow up, this latest video shares some ideas that could potentially come into play for this market, such as potential downside targets and pattern that may evolve in the next several weeks.
Hope you can benefit from this. :)

Related Topics:
* Free Trading Educational Video: Learn Technical Tips from Dan Gramza
* Learning Candlestick Charts
* Learning Charts Patterns
* Understanding Implied Volatility (IV)
* Understanding Option Greeks
* Understanding Option’s Time Value

Analysis Tool:
Get Free Trend Analysis for your favorite symbols

Saturday, October 31, 2009

Market Analysis Video: Has the S&P Index Topped Out for the Year?

Have we seen a top in the S&P index? This short video shows some analysis that indicates we may potentially be going to see a correction in this index.
Watch this video and see if you will agree with the arguments in regards to this market.

By watching the video, you’ll also learn more about the following:
* Trend line
* Fibonacci Retracement
* MACD Divergences

Although I posted this video a bit late, I’m sure you can still learn something from this due to its rich educational values in technical analysis. Happy watching! =)

Related Topics:
* Free Trading Educational Video: Learn Technical Tips from Dan Gramza
* Learning Candlestick Charts
* Learning Charts Patterns
* Understanding Implied Volatility (IV)
* Understanding Option Greeks
* Understanding Option’s Time Value

Analysis Tool:
Get Free Trend Analysis for your favorite symbols

Thursday, October 22, 2009

Market Analysis Video: Is the NASDAQ Now in Thin Air?

The major indexes have made some interesting moves lately, but the NASDAQ is currently at an interesting spot, as pointed out in this new video.

The video would give you some examples about Bearish Engulfing candlestick, Fibonacci Retracement and MACD Divergences. See how it can help you sharpen your technical analysis skills.
Happy watching. :)

Related Topics:
* Free Trading Educational Video: Learn Technical Tips from Dan Gramza
* Learning Candlestick Charts
* Learning Charts Patterns

Analysis Tool:
Get Free Trend Analysis for your favorite symbols

Friday, October 16, 2009

TRIPLE BOTTOM PATTERN – Part 1: Formation

Triple Bottom Pattern is a bullish reversal pattern that normally forms after an extended downtrend, which marks a shift in trend from bearish to bullish.

The Formation of Triple Bottom Pattern


Triple Bottom Pattern contains three consecutive, distinct & sharp bottoms at about the same price level, with two moderate peaks in between the bottoms, followed by a breakout through a resistance.
This pattern forms when the price is in an existing downtrend. It occurs when the price drops to a support level (forming the 1st bottom), then increases (forming the 1st trough), and then return to the support level (forming the 2nd bottom), then increase again (forming the 2nd trough), and then drop back to the resistance level again (forming the 3rd bottom), before subsequently increase further.

Although the price bottoms do not necessarily need to be exactly the same, but it should appear near the same price level.

The pattern is completed and confirmed when the price increases and closes above the highest high of the two peaks, which serves as the key resistance level in this pattern. This highest high point is called the “Confirmation Point”.

This pattern occurs because the sellers attempt to push the price lower, but are not able to do so as they are facing support, which prevents the continuation of the downtrend. After three failed attempts, the sellers in the market exhausted and gave up, and the buyers begin to be more aggressive to take control of the market and drive the price higher, pushing it up into a new uptrend.

To be continued to Part 2: Important Characteristics of Triple Bottom pattern.

To find out more about other Chart Patterns, please refer to:
Learning Charts Patterns

Related Topics:
* Free Trading Educational Video: Learn Technical Tips from Dan Gramza
* Learning Candlestick Charts
* Options Trading Basic – Part 1
* Options Trading Basic – Part 2
* Understanding Option Greek
* Understanding Implied Volatility (IV)
* Understanding Option’s Time Value

Analysis Tool:
Get Free Trend Analysis for your favorite symbols