Saturday, May 26, 2012
Home »
» Behaviour of DELTA in relation to IMPLIED VOLATILITY (IV) – With Past DATA and CHARTS
Behaviour of DELTA in relation to IMPLIED VOLATILITY (IV) – With Past DATA and CHARTS
Previously, we’ve covered about the behavior of Option Greeks in relation to time remaining to expiration.
From this post onwards, we’ll start to move on to discuss the behavior of Option Greeks in relation to Implied Volatility (IV).
The following is the behavior of Delta in relation to Implied Volatility (IV) changes:
When Implied Volatility (IV) increases, Delta of OTM option will increase, whereas the Delta of ITM option will decrease.
However, the Delta of ATM option will always remain at around 0.5.
Now, let’s observe using the past real data.
The following is the Options Chain for Call options of RIMM as at 3 Sep 2010, when the closing price is $44.78, expiration month Sep 2010 (10 days to expiration), and Implied Volatility (IV) is 25, 54.05, and 85, respectively.
(The rows highlighted in yellow are ITM options, while those in white are OTM).
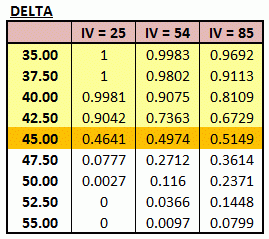
For easier reading and comparison, I summarize the Delta for different IV as follow:
As can be seen from the table, for ITM options (highlighted in yellow), the Delta values decrease when IV increases, i.e. as it moves from the left (IV = 25, the lowest IV in this example) to the right (IV = 85, the highest IV in this example).
In contrast, for OTM options (white rows in the table), the Delta values increase when IV increases.
For near ATM options (i.e. the option’s strike price $45.00, because the stock price is $44.78), the Delta is about the same, i.e. close to 0.5, across all IV levels.
Subsequently, we can look from different point of view, i.e. by comparing Delta at various strike prices at different IV level, as shown in the chart below.
From the chart, we can see that:
The effect of stock price changes on the option price (i.e. Delta) is more “extreme“ for ITM and OTM options with lower IV, as compared to those with higher IV.
Lower IV will push the Deltas of ITM Calls closer to 1 (-1 for Puts) and the OTM option’s Delta closer to 0.
In contrast, for ATM options, the Delta is relatively unaffected to changes in IV level, i.e. all will have Deltas close to 0.5.
To view the list of all the series on the this topic, please refer to:
“Behaviour of OPTION GREEKS in relation to TIME REMAINING TO EXPIRATION and IMPLIED VOLATILITY (IV) – With Past DATA and CHARTS.”
Other Learning Resources:
* FREE Trading Educational Videos with Special Feature
* FREE Trading Educational Videos from Trading Experts
Related Topics:
* Understanding Implied Volatility (IV)
* Understanding Option Greek
* Understanding Option’s Time Value
* Learning Candlestick Charts
* Options Trading Basic – Part 1
* Options Trading Basic – Part 2


0 comments:
Post a Comment