In the previous post, we discussed what volatility is and the differences between Historical Volatility (HV) and Implied Volatility (IV). Now, we’ll carry on with some websites for obtaining volatility information.
How To Get HV and IV Info
The following are the sources from which I usually find HV and IV info for FREE:
1) ivolatility.com.
This site provides some tools & data such as:
- Stock’s Historical Volatility (HV) and Implied Volatility (IV) figures (1 day lag).
- IV and Delta figures for near ATM options (No other Options Greeks info).
- Options Calculator.
It can be found under “Analysis Service” >> “Basic Calculator” at the left bar. - Volatility Charts.
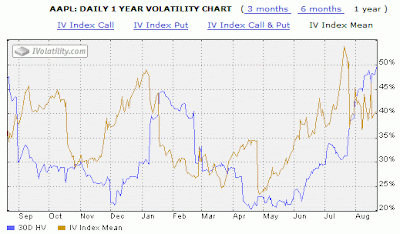
This chart shows Historical Volatility (HV) and Implied Volatility (IV) for 3 months, 6 months, and 1 year window (The charts are located at the right side). Advantage: What I like from the Volatility Chart in this site is that the time-scale (in terms of months) in the horizontal axis is very clear. Hence, it’s easier to make quick comparison between months.
Disadvantage: The stock price is plotted separately from HV vs. IV. Not too straightforward for analysis & comparison.

Picture courtesy of: www.ivolatility.com.
2) My options broker: OptionsXpress.
Here are volatility related tools / info I use from this site:
- Real-time IV figures for various strike prices and expiration months (not only near ATM options).
- Options Pricer.
This tool can be used to calculate theoretical option’s price (options calculator), as well as to show the real-time Options Greeks data (Delta, Gamma, Rho, Theta, and Vega). - Volatility Chart.
This chart shows Historical Volatility (HV) and Implied Volatility (IV) vs. Stock Price for 3 months, 6 months, and 1 year window.
Advantage: HV vs. IV vs. stock price, all plotted in one chart. It’s easier for analysis & comparison (e.g. The reason why there is a drastic surge in HV is because of the price gap up / down due to earnings announcement).
Disadvantage: The time-scale (in terms of months) in the horizontal axis is not very straightforward. Hence, it’s more difficult to make quick comparison between months.

Picture courtesy of: www.optionsxpress.com.
Note:
In case you want to find out more about OptionsXpress, I’ve previously shared my experience & knowledge about this broker in my prior post: “My Online Stock Option Brokers (Part 1)”.
Continue to Part 2 for more sources / websites.
To understand more about Implied Volatility, go to: Understanding Implied Volatility (IV).
Related Topics:
* FREE Trading Videos from Famous Trading Gurus
* Options Pricing: How Is Option Priced?
* Options Trading Basic – Part 1
* Options Trading Basic – Part 2
* Option Greeks


0 comments:
Post a Comment