OPTIONS

Friday, February 29, 2008

MORNING STAR vs. EVENING STAR

Both Morning Star & Evening Star are 3-day reversal patterns.
Whether a pattern is bearish or bullish reversal, it depends upon whether it appears at the end of a downtrend (Morning Star) or an uptrend (Evening Star).


Note:
The grey candle means the color of the candle’s body can be white or black (red).

MORNING STAR (BULLISH)
Morning Star is a bottom reversal pattern / bullish reversal pattern.
It may be formed at the end of a downtrend, or during a pullback within an uptrend, or at the support.

Morning Star pattern consists of 3 candlesticks:
1) A long-body black/red candle, extending the existing downtrend.
2) A small candle that gapped down on the open below the close of the previous candle. The color of the small candle can be white or black/red.
3) A long-body white candle that gapped up on the open and closed above the midpoint (half) of the black/red body of the first day.

In a downtrend or during a pullback within an uptrend, the long black/red candle confirms that the sellers (bears) remain strong.
When the 2nd candle gaps down, it provides further evidence of selling pressure. However, after the gap down, the decline does not continue, or it slows significantly, and a small candle is formed. The small candle indicates the lack of ability of the sellers (bears) to continue their strength, signaling the downtrend may be weakening and a possible reversal of trend.
On the 3rd day, the price gaps up and then rallies, forming a long white candle that closes above the midpoint level the black candle on the 1st day. This confirms the bullish reversal, particularly when there is a surge in volume.

EVENING STAR (BEARISH)
Evening Star
is a top reversal pattern / bearish reversal pattern.
It could be formed at the end of an uptrend, or during a bounce within a downtrend, or at the resistance.

Evening Star pattern consists of 3 candlesticks:
1) A long-body white candle, extending the existing uptrend.
2) A small candle that gapped up on the open above the close of the previous candle. The color of the small candle can be white or black/red.
3) A long-body black/red candle that gapped down on the open and closed below the midpoint (half) of the white body of the first day.

In an uptrend or during a bounce within a downtrend, the white candle confirms that the buyers (bulls) still dominate.
When the 2nd candle gaps up, it provides more evidence of buying pressure. However, after the gap up, the rally does not continue, or it slows significantly, and a small candle is formed. The small candle indicates the lack of ability of the sellers to continue their strength, signaling the uptrend may be weakening and a potential trend reversal could be nearing.
On the 3rd day, the price gaps down and then declines, forming a long black/red candle that closes below the midpoint level the white candle on the 1st day. This confirms the bearish reversal, particularly when there is a surge in volume.

To read about other Candlestick Patterns, go to: Learning Candlestick Charts.

Related Posts:
* FREE Trading Videos from Famous Trading Gurus
* Learning Charts Patterns
* Options Trading Basic – Part 1
* Options Trading Basic – Part 2
* Understanding Implied Volatility (IV)
* Option Greeks

Saturday, February 23, 2008

DESCENDING CHANNEL PATTERN

Descending Channel Pattern is a short-term bearish continuation pattern, whereby the price movement is contained within two parallel descending trend lines and the price is moving lower while bouncing off upper and lower down-trending lines.
Descending Channel pattern is also known as “Bearish Price Channel”.

The Formation of Descending Channel Pattern


Descending Channel Pattern has two parallel trend lines that are sloping downward.
In this case, the descending upper line acts as resistance, while the descending lower line as support.

In general, Price Channel pattern has Main Trend Line (or Primary Trend Line) and Channel Line (or Secondary Trend Line).
The Main Trend Line is the one that determine the trend and slope of the price channel, while the Channel Line is the line that is drawn parallel to the Main Trend Line.

For Descending Channel Pattern, the descending upper line serves as Main Trend Line, and the descending lower line as Channel Line.

To draw the Main Trend Line (descending upper line), there should be at least two consecutively lower peak (high) points to be connected. These two peaks should have some distance. In other words, prices should increase and hit the descending upper line then decline for at least twice (forming at least two peaks).

Likewise, to draw the Channel Line (descending lower line), there should be at least two consecutively lower trough (low) points to be connected. These two troughs should also have some distance. That means prices should drop and hit the descending lower line then bounce up for at least twice (forming at least two troughs).

These two down-trending lines should be parallel or close to parallel, and they can be extended down as well.

In Descending Channel pattern, the price should continue moving lower while bouncing off upper and lower trend lines, until a breakout occurs and either trend line is broken.

As such, one effective way to trade this pattern is by short selling the stock on the upper trend line (resistance level) for short-term trade.
Although it is possible to buy the stock on the lower trend line (support level), this trade may carry more risk because one would be trading against the trend. And trading against the trend will usually be much riskier. (Remember the well-known trading phrase: "The Trend is Your Friend").

Breakout
The breakout from Descending Channel pattern may happen to the upside (i.e. the price penetrates through the upper trend line) or to the downside (i.e. the price penetrates through the lower trend line).

As with the other patterns, the minimum penetration criteria for a breakout should be price closes outside either trend lines, not just an intraday penetration.

A breakout to the upside from Descending Channel that indicates the short-term downtrend might have come to an end, and it provides a technical “Buy” (Bullish) signal.

A breakout to the downside indicates that that a selling intensity has increased, resulting in accelerated price decrease. This provides a technical “Sell” (Bearish) signal.

To read about other chart patterns, go to: Learning Charts Patterns.

Related Topics:
* FREE Trading Videos from Famous Trading Gurus
* Understanding Candlestick Charts
* Options Trading Basic – Part 2
* Understanding Implied Volatility (IV)

Monday, February 18, 2008

ASCENDING CHANNEL PATTERN

Ascending Channel Pattern is a short-term bullish continuation pattern, whereby the price movement is contained within two parallel ascending trend lines and the price is moving higher while bouncing off upper and lower up-trending lines.
Ascending Channel pattern is also known as “Bullish Price Channel” or “Rising Channel”.

The Formation of Ascending Channel Pattern


Ascending Channel Pattern has two parallel trend lines that are sloping upward.
In this case, the ascending lower line acts as support, whereas the ascending upper line as resistance.

In general, Price Channel pattern has Main Trend Line (or Primary Trend Line) and Channel Line (or Secondary Trend Line).
The Main Trend Line is the one that determine the trend and slope of the price channel, while the Channel Line is the line that is drawn parallel to the Main Trend Line.

For Ascending Channel Pattern, the ascending lower line serves as Main Trend Line, and the ascending upper line as Channel Line.

To draw the Main Trend Line (ascending lower line), there should be at least two consecutively higher trough (low) points to be connected. These two troughs should have some distance. That means prices should drop and hit the rising lower line then bounce up for at least twice (forming at least two troughs).

Similarly, to draw the Channel Line (ascending upper line), there should be at least two consecutively higher peak (high) points to be connected. These two peaks should also have some distance. In other words, prices should increase and hit the rising upper line then decline for at least twice (forming at least two peaks).

These two up trending lines should be parallel or close to parallel, and they can be extended up as well.

In Ascending Channel pattern, the price should continue moving higher while bouncing off upper and lower trend lines, until a breakout occurs and either trend line is broken.

Therefore, one effective way to trade this pattern is by buying the stock on the lower trend line (support level) for short-term bounce plays.
Although it is possible to short sell the stock on the upper trend line (resistance level), this trade may carry more risk because one would be trading against the trend. And trading against the trend will usually be much riskier. (Remember the well-known trading phrase: "The Trend is Your Friend").

Breakout
The breakout from Ascending Channel pattern may happen to the upside (i.e. the price penetrates through the upper trend line) or to the downside (i.e. the price penetrates through the lower trend line).

As with the other patterns, the minimum penetration criteria for a breakout should be price closes outside either trend lines, not just an intraday penetration.

A breakout to the upside from Ascending Channel indicates that a buying intensity has increased, resulting in accelerated price increase. This provides a technical “Buy” (Bullish) signal.

A breakout to the downside indicates that the short-term uptrend might have come to an end, and it provides a technical “Sell” (Bearish) signal.

To read about other chart patterns, go to: Learning Charts Patterns.

Related Posts:
* FREE Trading Educational Resources You Should Not Miss
* Learning Candlestick Charts
* Options Trading Basic – Part 2
* Understanding Implied Volatility (IV)
* Option Greeks

Thursday, February 14, 2008

Love Links

Happy Valentine’s Day to all my readers!
May you have a specially sweet and memorable day today by spending it with your loved ones. :)

By the way, it’s been quite a while I didn’t provide links to many excellent educational readings out there.
Here are some of them. Check them out!

Trading Wise Words: What Is Discipline in Trading?

OptionAddict: Selecting an Option... With a Hint of Gamma

Afraid To Trade: Insights from Volume and Open Interest

Afraid To Trade: Thoughts on Frustration in Achieving Trading Success

Time Is Money: The Holy Grail Setup Explained

A Trade A Day: Flag Pattern

Chris Perruna: Trading Mistakes: Avoid at all Costs

Thomas N. Bullowski in SmartMoney: Lessons Learned After 25 Years of Trading

TraderFeed: The Best of TraderFeed: Resources for Becoming Your Own Trading Coach

Monday, February 11, 2008

RECTANGLE PATTERN – Part 2: Important Characteristics

Go back to Part 1: Rectangle Formation

Important Characteristics of Rectangle Pattern:

Existing Trend:
There should be an established existing trend (either uptrend or downtrend) in order for the pattern to qualify as a continuation pattern.

Shape of Rectangle Pattern:
* There should be at least 4 reversal points to draw two parallel lines, i.e. two equivalent peak (high) points forming a horizontal upper line (resistance) and two equivalent trough (low) points forming a horizontal lower line (support).
* There should be some distance between the two peaks as well as the two troughs
In other words, prices should increase and hit the horizontal upper line then decline for at least twice (forming at least two peaks). Prices should drop and hit the horizontal lower line then bounce up for at least twice (forming at least two troughs).

Volume:
Unlike Triangle pattern whereby volume should be diminishing as the triangle develops, for Rectangle pattern there is no standard pattern for the volume.

Volume could sometimes be contracting as the Rectangle is forming, but it might be fluctuating as well.
The fluctuation can be random, or may also show certain tendency.
For example, volume tends to increase as the price is nearing to resistance (upper line), and decreasing as the price moves toward support (lower line).
When such volume pattern happens, it could offer an indication on the possible breakout direction (in this example, it might break out to the upside).

When breakout occurs, volume should be expanding.

Duration:
On a daily chart, this pattern may take from few weeks to many months to form.
If the pattern duration is less than 3 weeks, it is usually considered as a bullish / bearish flag.

Generally, the longer the duration of the pattern, the more significant the breakout would be.
A 3-month pattern might be expected to meet its breakout’s potential price target.
However, a 6-month pattern is likely to exceed its breakout target.

Breakout Direction:
Breakout from Rectangle pattern can happen in either direction (upside or downside).
Hence, the direction of the breakout can only be determined after the breakout has occurred.

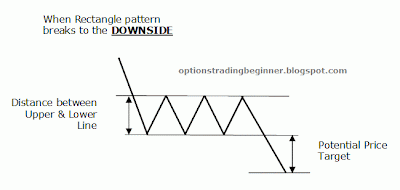
Potential Price Target:
1) Compute the height of the Rectangle: The distance between the upper line (resistance) and lower line (support).
2) To compute the potential price target:
When the breakout is to the upside of the upper line: Add the result to the upper line.
When the breakout is to the downside of the lower line: Subtract the result from the lower line.

Return to Breakout Level:
After the breakout occurs, it is common that prices may return to the breakout level for an immediate test of this new support (when break to the upside) or resistance level (when break to the downside) before continuing their moves in the direction of the breakout.
This could actually offer an opportunity to participate in the breakout with a better reward to risk ratio.

Breakout Confirmation:
* A minimum penetration criteria for a breakout should be price closes outside the upper line (for breakout to the upside) or lower line (for breakout to the downside), not just an intraday penetration.
Some traders may apply certain price criteria (e.g. 3% - 5% break from the upper / lower line depending on the stock’s volatility) or time criteria (e.g. the breakout is sustained for 3 days) to confirm the validity of the breakout.
* If the price returns back inside the Rectangle on a closing price basis, the breakout can be deemed invalid.

To read about other chart patterns, go to: Learning Charts Patterns.

Related Topics:
* FREE Trading Educational Videos on Technical Analysis You Should Not Miss
* Learning Candlestick Charts
* Options Trading Basic – Part 2
* Understanding Implied Volatility (IV)
* Option Greeks
Monday, February 4, 2008

RECTANGLE PATTERN – Part 1: Formation

Rectangle Pattern is a neutral pattern that normally forms during a trend (either uptrend or downtrend) as a continuation / consolidation pattern.
The breakout usually occurs in the same direction as the previous trend, although it may break against the previous trend as well.
Rectangle pattern is also known as “trading range”, “box pattern”, "rectangular pattern”, “consolidation zones”, or “congestion areas”.

The Formation of Rectangle Pattern


Rectangle Pattern contains at least two equal highs (peaks) and two equal lows (troughs). When the peak as well as trough points are connected by separate lines, they would form two parallel, horizontal lines that give the pattern its rectangle shape.
In this case, the horizontal upper line acts as resistance, whereas the horizontal lower line as support.

The pattern is completed when a break out occurs, i.e. when prices penetrate through either the upper line (i.e. breakout to the upside) or lower line (i.e. breakout to the downside) on expanding volume, and the trading range is broken as a result.

This pattern occurs because the price movement is contained by two parallel lines.
Rectangle pattern represent a trading range whereby the buyers’ and sellers’ strengths are near equilibrium.
As prices near the support (upper line), the buyers (bulls) step in and drive the prices higher.
In turn, as prices near the resistance (lower line), the sellers (bears) take over and push the prices lower.
In the end, either the buyers or sellers managed to find enough conviction to break out to one side with great force.

Continue to Part 2: Important Characteristics of Rectangle pattern.

To read about other chart patterns, go to: Learning Charts Patterns.

Related Posts:
* FREE Trading Educational Videos You Must Not Miss
* Learning Candlestick Charts
* Options Trading Basic – Part 2
* Understanding Implied Volatility (IV)
* Option Greeks