Monday, June 4, 2007
Home »
How To Get Started Trading
,
Stock Options Brokers
» How To Start A Real-time Streaming Chart in OptionsXpress
How To Start A Real-time Streaming Chart in OptionsXpress
In the earlier post, I mentioned that if you open an account with OptionsXpress (OX), you can use their real-time streaming chart for free. Since I’m familiar with OX charts, for the benefit of the beginners or those who have just opened an account with OX and still not familiar with it, I’d like to share here the steps to start live streaming chart in OX, so that you can save some exploring time. Hope it can be useful. :)
Note:
You need to ensure that you’ve install (latest) Java software so that the streaming charts will work.
STEPS TO START THE JAVA STREAMING CHART IN OPTIONSXPRESS (OX):
1. Click: Quotes >> Chart >> Java Charts.
2. Wait for a while. Take some times for loading the chart.
3. After the chart is loaded, you can then select your chart setting:
a) Chart type: Candle, Bar, Line, etc.
b) Chart Window (Period of the chart): 1 day, 2 days, 1 mth, 3 mth, 6 mth, 1 year, etc.
c) Time frame: D (Daily), W (Weekly), M (Monthly), Q (Quarterly), Y (Yearly).
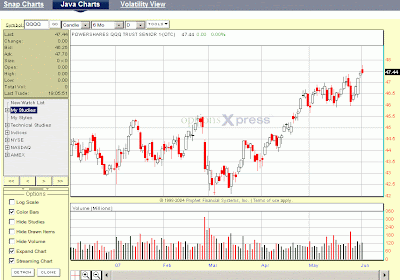
4. You can also set your chart options and select respectively in the “Options” box at the bottom left corner if you want: Log scale or normal scale, color the chart or just black & white, to hide / unhide studies or drawn item or volume.
5. To activate the real-time streamline chart, you need to tick the “Streaming Chart” in the “Options” box. Once it’s ticked, a new box appears in the top left corner below the stock ticker (“Symbol”), showing Last, Bid, Ask, Volume, etc. You will notice that these quotes and the price highlighted in black (at the left side) are moving during trading hours.
6. However, the candle (if you choose candle as your chart type) may not be adjusting the price movement as fast. You can refresh it by clicking “Go” near the box where you type the stock ticker (top left corner).
Update:
If you want the chart to stand by itself as a separate window, you can detach the chart.
You can also clone the charts, so that you can monitor a few stock charts simultaneously.
Read this post on how to detact & clone charts in OptionsXpress.
1 comments:
Hi :
Nice article in teaching how to set up a real-time chart in OX. I've been using it ever since I trade options.
Yours Truly,
Tony Chai
a disabled stock option trader
http://options4u.blogspot.com
Post a Comment