OPTIONS

Friday, June 29, 2007

Some Random Links

Here are some random links for this week:

* Dr. Brett Steenbarger had excellent posts on how one should initiate a trading learning process and how to regain trading consistency.

* Adam’s Daily Option Report showed how he looked at VIX through a different lens.

* Option Pundit wrote a great article on how to value stock.

* Simply Options Trader shared her tricks on how to find a low risk entry here.

* JMOT listed some common ways of choosing the right stock in this post.

Have a nice weekend ahead. :)

Wednesday, June 27, 2007

Stock Watch – MLM, PWR, B, PCLN, JCOM

One of my favorite setup is a bounce off a trend line after pull back. I like this kind of setup, because it usually provides a high probability & low risk entry for a swing trading. As we often heard, “Trend is your friend” and “Don’t trade against the trend”.

During the recent sell-off, many uptrending stocks have pulled back to their trend line or 20 MA, whereby historically such stocks would continue their upward moves after the pullback to that line.

The following are some of the stocks with potential bounce moves after the pull back, when the market starts to bounce up from the recent sell-off.


Tuesday, June 26, 2007

Option Greeks: VEGA

Vega measures the sensitivity of an option’s price to changes in Implied Volatility (IV). Vega estimates how much an option price would change when volatility changes 1%.

A change in IV will affect both Calls and Puts options the same way:
An increase in IV will increase an option’s price, while a decrease in IV would decrease an option’s price.

The reason for this is that higher volatility implies greater expected fluctuations in the stock price, which means a greater possibility for an option to move into your favor by expiration.
Since higher volatility leads to higher option price (assuming other things constant), an increase in IV would benefit option buyers, but will be detrimental for option sellers (for both Calls & Puts). Whereas a decrease in IV would have a negative impact on option buyers, but will be beneficial for option sellers.

Example:
The current price of ABC May 50 Call is $3, with Vega 0.20 and the volatility of ABC stock is 35%. If the volatility of ABC increases to 36%, the ABC May 50 Call’s price will rise to $3.20. If the volatility of ABC drops to 34%, the ABC May 50 Call’s value will drop to $2.80.

Vega and the position in the market:
* Long calls and long puts both always have positive vega.
* Short calls and short puts both always have negative vega.
* Stock has zero vega – it’s value is not affected by volatility.

Positive vega means the option price increases when volatility increases, and decreases when volatility decreases.
Negative vega means the option price decreases when volatility increases, and increases when volatility decreases.

Vega of ATM, ITM & OTM Option
The impact of volatility changes is greater for ATM options than for the ITM & OTM options.
Vega is highest for ATM options, and is gradually lower as options are ITM and OTM.
This means that the when there is a change in volatility, the value of ATM options will change the most. This makes sense because ATM options have the highest time value component, and changes in Implied Volatility would only affect the time value portion of an option’s price.
Comparing between ITM & OTM options, the impact of volatility changes is greater for OTM options than it is for ITM options.

The Impact of Time Remaining to Expiration on Vega
Assuming all other things unchanged, Vega falls when volatility drops or the option gets closer to expiration.
Vega is higher when there is more time remaining to expiration. This makes sense because options with more time remaining to expiration have larger portion of time value, and it is the time value that is affected by changes in volatility.

Other Important Characteristics of Vega:
a) Vega can move even without any changes in the underlying stock price (e.g. stocks with low Historical Volatility), because Implied Volatility (IV) is the level of expected volatility.
When Implied Volatility (IV) is high, you might want to find out what causes the high expectations. It could be due to earnings announcement is nearing, pending for FDA approvals, or some other important event / news which is expected to move the stock price drastically.
Adam's Daily Option Report has a great example in this article.

b) Vega can surge drastically due to sudden changes in the stock price, either up or down (such as a stock crash or a rapid big jump in the stock price).

To read about other Option Greeks, go to: Option Greeks.

Related Posts:
* Learn Trading from Trading Experts for FREE
* OPTION PRICING: How Is Option Priced?
* Understanding IMPLIED VOLATILITY (IV)
* Difference Between Option’s Volume and Open Interest
* Options Trading Basic – Part 2

Sunday, June 24, 2007

Thank You From The Bottom Of My Heart

Investment blogosphere lost another great bloggers. Trader X and Yaser Anwar have decided to stop blogging. While not long ago, Estocastica as well as ODA125 of Options The Easy Way left the blogosphere too.

I really feel sad and lost. I am one of those many people who have benefited from their wonderful insights they shared in their blogs.

Frankly, though I took paid courses and spent thousands bucks for trading education, I can say I actually learn much more from all the great investment / trading blogs around than what I got from the paid courses. It’s through reading the blogs, I’ve grown and improved as a trader. When I was feeling down and devastated from the trading setbacks I encountered, it’s through reading the blogs I got encouragement to stand up again, regain my confidence and move on.

I knew that blogging is not easy. But I never imagine that blogging is really that hard until I started blogging myself. Blogging does take one’s time and energy. Not only to prepare the contents. Sometimes, it took a long time just to upload pictures into the blog. Not to mention some other annoying problems when the (Blogger) system is having problem.

I can’t thank them enough for what I have been learning from all of them. They have done so much for us. But what have we done for them in return? I knew from Adam’s Daily Options Report, Abnormal Returns has written a great article about the topic. OptionPundit too shared his feeling here.

Hence, through this simple post, I’d like to thank all the great bloggers. I am truly indebted to them. For those who have left, I respect their decision and wish them all the best in their future endeavors. For those who still persevere to contribute in the blogosphere, thanks for still being there for us.

Once again, thank you very much from the bottom of my heart. Deeply and sincerely. God bless you all.

Thursday, June 21, 2007

Some Interesting Stock Charts Pattern

I came across some interesting stock chart pattern. Here they are.

PLXS: Forming an ascending triangle recently.


UTHR: Forming an interesting bullish flag pattern. Seems like It’s testing the support at around 63.5 now.

Wednesday, June 20, 2007

Update Stock Watch – CG

In the earlier post, I highlighted CG for its possibility to break out of the ascending triangle. The stock did make an attempt to break out by gapping up in the opening on 15 Jun, but it failed. However, as of yesterday, the ascending triangle pattern seems still intact with 50 MA acting as a strong support.


Although in theory, ascending triangle pattern is generally expected to lead to a breakout / upward moves (i.e. continuation pattern of the existing trend, which is trending up), in reality we also saw that some of such pattern led to a breakdown instead, if the market fails to break the resistance at the upper triangle.

Anyway, as we know, everything is possible in the market. Even the best looking pattern may end up doing something the least we expect. We’re always playing probability games in market. So, the most important thing is always your risk & money management.

Let’s just see what the market will do with this stock. And always, do trade with care. :)

Option Greeks: THETA

Theta is a measure of the rate of decline of option’s time-value resulting from the passage of time (time decay).
Theta provides an estimate of the dollar amount that an option price will lose each day due to the passage of time and there is no move in either the stock price or volatility.

Theta and the position in the market:
• Long calls and long puts always have negative theta.
• Short calls and short puts always have positive theta.
• Stock has zero theta – its value is not eroded by time.

Positive theta means that the option value will increase as the time passes, while negative theta means the option value will fall as the time passes.

Therefore, it makes sense that long options have negative theta and short options have positive theta. If options are continuously losing their time value as days pass, a long option position will lose money because of theta, whereas a short option position will make money because of theta.

But theta does not reduce an option’s value in an even rate. Theta has much more impact on an option that is nearing expiration than an option that is still far away from expiration.
The further is an option from its expiration date, the smaller the time decay (theta) will be for the option.
This implies that if you want to buy options (Calls or Puts), it is advantageous to buy longer term contracts to minimize the time decay effect.
However, if you want a strategy to take advantage of time decay, then you should sell the shorter term options, so that the loss in time value would happen quickly.

Example:
The price of ABC May 50 Call with 25 days to expiration is $3. Its theta is -0.10. The price of ABC Jul 50 Call with 85 days to expiration is $4.8, and the theta is -0.03. When one day passes and there is no change in ABC stock price as well as the implied volatility of either options, the value of ABC May 50 Call will decrease by $0.10 to $2.9, and the value of ABC Jul 50 Call will drop by $0.03 to $4.77.

Theta of ATM, ITM & OTM Option
Theta is typically highest for ATM options, and is progressively lower as options are ITM and OTM.
This makes sense because ATM options have the highest time value component, so they have more time value to lose over time than an ITM or OTM option.

The Effect of Time Remaining to Expiration on Theta

For ATM option, Theta increases as an option get closer to the expiration date.

In contrast, for ITM & OTM options, Theta decreases as an option is approaching expiration. The above effects are particularly observed in the last few weeks (about 30 days) before expiration.

The Impact of Implied Volatility (IV) on Theta
When Implied Volatility (IV) decreases, Theta will be lower, especially when it is approaching expiration.
On the other hand, when IV increases, Theta would be higher.

Comparing more volatile stocks (higher volatility stocks) vs. less volatile stocks (lower volatility stocks), the theta of more volatile stocks is higher than that of less volatile stocks. This is because the time value portion of more volatile stocks is higher, and therefore they have more to lose per day as time passes.

To read about other Option Greek, go to: Option Greeks.

Related Posts:
* More Understanding about Options Time Value
* OPTION PRICING: How Is Option Priced?
* Difference Between Option’s Volume and Open Interest
* Understanding Implied Volatility (IV)
* Options Trading Basic – Part 2
* FREE Trading Videos from Famous Trading Gurus

Monday, June 18, 2007

Option Greeks: GAMMA

Gamma measures the rate of change of delta due to a one-point change in the price of the underlying stock. In other words, Gamma estimates how much delta would change if the price of the underlying stock changes by $1. So, gamma can tell you how “stable” your delta is. A big gamma means that your delta can start changing considerably for even a small move in the stock price.
Unlike delta, gamma is always positive for both Calls and Puts.

Example:
ABC Jun 60 Call has a delta of +0.25 and ABC Jun 60 Put has a delta of -0.75. The current ABC stock price is 50. The gamma for both the ABC Jun 60 Call and Put is 0.03.
If the stock increases by $1 from $50 to $51, the delta of ABC Jun 60 Call will become +0.28 [= +0.25 + ($1 * 0.03)], and the delta of ABC Jun 60 Put becomes -0.72 [= -0.75 + ($1 * 0.03)].
If the stock falls by $1.00 to $49, the delta of ABC Jun 60 Call becomes +0.22 [= +0.25 + (-$1 * 0.03)], and the delta ABC Jun 60 Put becomes -0.78 [= -0.75 + (-$1 * .03)].

Gamma and the position in the market:
* Both long calls and long puts always have positive gamma.
* Both short calls and short puts always have negative gamma.
* Stock has zero gamma because its delta is always 1.00 – it never changes.

Initially, it was quite hard for me to understand why “both long calls & long puts always have positive gamma” and “both short calls and short puts always have negative gamma”. Until I drew a “delta ruler” (see picture below) which could really help me to understand the above concepts.


Now, I’ll try to elaborate more on how this “ruler” has helped me to understand Gamma concepts.
Before we start, let’s refresh the concepts we discussed earlier in “Delta – Part 1”:
* Long calls have positive delta; short calls have negative delta.
* Long puts have negative delta; short puts have positive delta.

POSITIVE GAMMA means the delta will increase when the underlying stock price increases, and will decrease when the stock price decrease (positive relationship).

What does “long calls have positive gamma” mean?
Since the delta of long calls is positive, when the stock price rises, the delta of long calls will increase, i.e. it becomes more positive and moves towards +1.
In contrast, when the stock price falls, the delta of long calls will decrease, whereby it becomes less positive and moves towards 0.

And what does “long puts have positive gamma” mean?
Since the delta of long puts is negative, when the stock price rises, the delta of long puts will increase, whereby it becomes less negative and moves towards 0.
On the other hand, when the stock price falls, the delta of long puts will decrease, meaning that it becomes more negative and moves towards -1.

NEGATIVE GAMMA means the delta will decrease when the underlying stock price rises, and will increase when the stock price drops (negative relationship).

What does “short calls have negative gamma” mean?
Since the delta of short calls is negative, when the stock price rises, the delta of short calls will decrease, i.e. the delta becomes more negative and moves towards -1.
On the other hand, when the stock price falls, the delta of short calls will increase, whereby the delta becomes less negative and moves towards 0.

What does “short puts have negative gamma” mean?
Since the delta of short puts is positive, when the stock price rises, the delta of short puts will decrease, whereby the delta becomes less positive and moves towards 0.
On the contrary, when the stock price falls, the delta of short puts will increase, i.e. the delta becomes more positive and move towards 1.

Gamma of ATM, ITM & OTM Options
Gamma is the largest for the At-The-Money (ATM) options, and gradually gets lower as it moves furthers towards In-The-Money (ITM) and Out-Of-The-Money (OTM). This means that the delta of ATM options changes the most when the stock price moves up or down, as compared to ITM & OTM options.
Hence, practically speaking, an ATM Call can provide a good balance of potential profit if the stock rises versus loss if the stock falls. An OTM Call will not make as much money if the stock price increases, and an ITM will lose more money if the stock price drops.

To read about other Option Greeks, go to: Option Greeks.

Related Posts:
* FREE Trading Videos from Trading Experts You Should Not Miss
* OPTION PRICING: How Is Option Priced?
* Understanding Implied Volatility (IV)
* Difference Between Option’s Volume and Open Interest
* Options Trading Basic – Part 2

Friday, June 15, 2007

Stock Watch : CG Ready To Break Out?

CG has been forming an ascending triangle lately. Look at the recent price action. Seems like it’s ready to break out soon? Just watch out. :)
As for me, I prefer to wait for a pullback after the breakout happens.

Option Greeks: DELTA (Part 3)

Go back to “Delta - Part 2”.

Although some people may not be totally agreeable, there is another way how we can “interpret” Delta.
Options Guy’s Blog posted an article about another “definition” of delta:
”Delta is the probability of the option contract being in-the-money at expiration”.

I agree that this is not the theoretical definition of Delta. I still use delta data as per the theoretical definition, i.e. how much the option’s theoretical value will change when the stock price changes by $1.
But I do feel that the other “definition” of delta has helped me to understand more about some “behavior” of delta.

For instance:

Why for ITM options, for the same strike price, the longer days to expiration, the lower the delta?
Because ITM option with more days to expiration has more time to move.
Options Guy argues that “more time to move means less likelihood of the option still being in-the-money at expiration; this translates into a smaller Delta”.

And why for OTM options, for the same strike price, the longer days to expiration, the higher the delta?
Options Guy argues that “if you’re buying OTM options, you need time for the stock to move up to the strike price. In other words, there’s a much higher probability of the underlying finishing ITM for the [longer to expiration] option than for the [nearer to expiration option]; Delta reflects that probability”.

Likewise, we can also use the same logic to answer this question:
Why a decrease in volatility will push the deltas of ITM Calls closer to 1 (-1 for Puts) and the OTM options’ delta closer to 0.
Because decreased (implied) volatility means the future stock price fluctuation is expected to be lower. As a result, for ITM options, the probability of the options to be still in-the-money at expiration will be higher, which translates into a higher Delta.
On the other hand, for OTM options, decreased (implied) volatility would lower their probability to be in-the-money at expiration. And the lower delta reflects that probability.

Hope this can help you to better understand Delta too. :)

To read about other Option Greeks, go to: Option Greeks.


Related Topics:
* Trading Educational Videos You Should Not Miss
* OPTION PRICING: How Is Option Priced?
* Options Trading Basic – Part 2
* Difference Between Option’s Volume and Open Interest

Wednesday, June 13, 2007

Option Greeks: DELTA (Part 2)

Go back to “Delta - Part 1

Factors That Affect Option’s Delta
There are a few factors that influence option’s Delta:

a) How close or how far away the stock price from the strike price.
At-the-money (ATM) options have deltas around 0.5; Out-of-the-money (OTM) options have deltas between 0 to 0.5; In-the-money (OTM) options have deltas between 0.5 to 1. (The delta values will be positive for Calls & negative for Puts).
When options are deep OTM, they have a small delta, because changes in the stock price will lead to only small changes in the option price. But as the options move towards in the money resulting from a continued rise in the stock price, the delta gets larger.

As the stock price moves and an option gets deeper ITM, delta will change and would be approaching 1 for Call and –1 for Put. When the delta is near 1 for Call or -1 for Put, the options will begin to trade like a stock, moving almost dollar for dollar with the stock price. This occurs with little or no time value, as most of the value of the option is intrinsic.

Example:
ABC stock is currently trading at $50. The price of May 50 Call option (ATM option) is $3. The ATM option’s delta is 0.5. If the stock rises by $1 from $50 to $51 (all other factors unchanged), the option price will theoretically increase by $0.5 from $3 to $3.5. So, if we own one contract (long position), we will gain $50 (=0.5 x 100 shares/contract).
Now, if the stock rises $1 further from $51 to $52, will the option price move $0.5 again, or more or less than that? The answer is more than $0.5. Because when the stock was trading at 51, the option’s delta should be about 0.60, so when the stock made another $1 move, the option price will increase $0.6, from $3.5 to $4.1.

b) Changes in volatility and time to expiration.
Changes in volatility or time to expiration will change delta. Even though the stock price does not move, delta will change when there are changes in volatility or time to expiration.
However, for ATM options, the delta is relatively unaffected to changes in volatility or time to expiration. This means both ATM options with 90 days and 30 days to expiration will have deltas close to 0.5 (Assuming other factors constant).

In contrast, for ITM & OTM options, the more ITM or OTM an option is, the more sensitive its delta is to changes in volatility or time to expiration.
Fewer days to expiration or a decrease in volatility will push the deltas of ITM Calls closer to 1 (-1 for Puts) and the OTM options’ delta closer to 0.

The Impact of Time Remaining To Expiration on Delta
An option’s Delta does change as one trading day passes. This is often called as “Delta Decay”.
As the expiration is nearing (time to expiration gets shorter), the time value portion of an option is declining (time decay effect). This causes the delta of ITM options to increase (i.e. ITM option’s delta gets closer to 1 for Calls or to -1 for Puts) and the delta of OTM options to decrease (i.e. OTM option’s delta gets closer to 0).

As a result:
For ITM options, for the same strike price, the longer days to expiration, the lower the delta. Hence, a next month ITM option will have a lower delta than the current month option.
On the other hand, for OTM options, for the same strike price, the longer days to expiration, the higher the delta. So, a next month OTM option will have higher delta than the current month option.

The Impact of Implied Volatility (IV) on Delta
When volatility increases, the time value portion of the option will rise. As a result, the delta of OTM options goes up, whereas the delta of ITM options goes down.

c) Changes in stock price.
The option’s delta changes when the stock price changes. The sensitivity of delta to the movement of the stock price is measured by Gamma.

Continue to “Delta - Part 3”.

To read about other Option Greeks, go to: Option Greeks.

Related Topics:
* FREE Trading Educational Videos You Should Not Miss
* Options Trading Basic – Part 1
* Options Trading Basic – Part 2
* Understanding Implied Volatility (IV)
* Learning Candlestick Charts
* Learning Charts Patterns

Tuesday, June 12, 2007

Option Greeks: DELTA (Part 1)

What is Delta?
Delta is a measure of the change in the option’s price resulting from a change in the underlying stock price. It estimates how much the theoretical value of option price will change when the price of the underlying stock changes by $1, assuming all other variables are unchanged.

Positive delta means that the option’s value will increase when the underlying stock price increases, and will decrease when the stock price decreases (positive relationship).
Negative delta means that the option’s value will increase when the underlying stock price drop, and will decrease when the stock price rises (negative relationship).

For Calls, the value of delta ranges from 0 to 1, whereas for Puts from -1 to 0.
Calls have a positive delta because Call premiums increases when the underlying stock price increases, and vice versa, assuming all other factors remain the same.
In contrast, Puts have a negative delta because the Put option price drops when the stock price goes up, and vice versa.

It is interesting to note that for every Strike Price in the Option Chain, if you add the absolute values of delta of Call & Put, the sum will always be 1.
For example, the delta of ABC Jun 60 Call is 0.25 and the delta of ABC Jun 60 Put is -0.75. The sum of their absolute values is: ¦0.25¦ + ¦-0.75¦ = 1.

Delta and the position in the market:
· Long calls have positive delta; short calls have negative delta.
· Long puts have negative delta; short puts have positive delta.
· Long stock has positive delta; short stock has negative delta.

Continue to “Delta - Part 2”.

To read about other Option Greeks, go to: Option Greeks.

Related Topics:
* Options Trading Basic – Part 1
* Options Trading Basic – Part 2
* Understanding Implied Volatility (IV)
* Getting Started Trading
* FREE Trading Videos from Famous Trading Gurus

Monday, June 11, 2007

OPTION GREEKS - Introduction

The "Greeks" in options trading is known as a way to measure the sensitivity of an option price to changes in its parameters. The Greeks can help option traders to better understand the potential risk and reward of an option position. However, it is important to note that the numbers given for each of the Greeks are strictly theoretical, as they are only projected based on mathematical models.

In addition, the Greeks numbers also change as the conditions (like actual stock price, volatility) change. How the various Greeks move as conditions change depends on how far the strike price is from the actual price of the stock (Deep ITM or ATM or deep OTM) and how much time is left until expiration.

Options Greeks numbers are usually presented in Greeks tables. The numbers shown in the Greeks table are normally in decimals that indicate the change per share. To normalize the Greeks for dollars, just multiply them by 100 (the number of shares per option contract).

Samples of Greeks Tables for Call Options:


Samples of Greeks Tables for Put Options:


The following are the major Greeks in options trading:

1. Delta
Delta is a measure of the change in the option price resulting from a change in the underlying stock price.

2. Gamma
Gamma is a measure the rate of change of delta due to a one-point change in the price of the underlying stock.

3. Theta
Theta is a measure of the rate of decline of option’s time-value resulting from the passage of time (TIME DECAY).

4. Vega
Vega is a measure the sensitivity of an option’s price to changes in Implied Volatility (IV).


5. Rho
Rho is a measure of the change in an option's price due to a change in interest rate.

We’ll discus each of the Greeks further in the next posts.

To read further about each of the Option Greeks, go to: Option Greeks.

Related Posts:
* OPTION PRICING: How Is Option Priced?
* Understanding IMPLIED VOLATILITY (IV)
* Difference Between Option’s Volume and Open Interest
* FREE Trading Videos from Famous Trading Gurus

Friday, June 8, 2007

How To Apply Stock Chart Indicators In OptionsXpress

Stock charts without any indicators / studies will look “naked”. Indicators / studies chart (e.g. Moving Average, MACD, Stochastic, RSI, etc.) help tremendously in our chart analysis.

The following is the steps to apply indicators / studies in the stock charts in OptionsXpress:

1. Click the “Tools” button on top of the chart >> Studies >> Apply Studies.

2. A window will pop up. You can choose any studies under “Select Studies” list. There are many indicators / studies available there. After you select, then click “Add”.

3. After you are done selecting the studies, you can save them for future use.

If you have more that one saved studies, you can manage them from “My Studies” at the right side. Click the “plus” sign to list down all the studies, then double-click the study you want to apply in the chart.

Related Post:
How To Start A Real-time Streaming Chart in OptionsXpress
How To Detach & Clone Charts in OptionsXpress

Wednesday, June 6, 2007

How To Detach & Clone Charts in OptionsXpress

In the previous post, I showed the step-by-step guide to start real-time streaming chart in OptionsXpress (OX).
After starting the chart, you can also detach the chart and make it as a new window, and clone it so that you can monitor more than one stock chart at the same time.

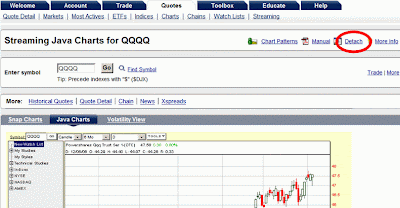
There are 2 ways to detach the chart:

Option 1:
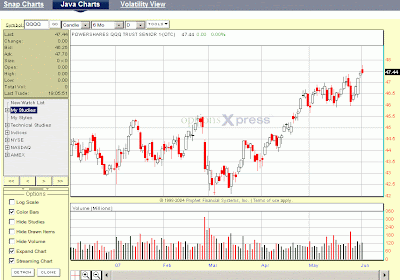
Click the “Detach” button in the “Options” box at the bottom left corner. (See picture below)


Option 2:
Click the “Detach” button at the top right corner. (See picture below)


There is a difference when using Option 1 & 2:

Using Option 1, the detached chart actually does not “stand” by itself, although it’s become a separate window. So, when you go to the main page and would like to use other tools (for instance, you want to check out the Option Chain by clicking “Chain” option under the “Quotes” tab), the chart window will disappear.

Using Option 2, the detached chart would “stand” by itself. Hence, when you want to use the other tools in the main page, the chart window will not disappear.
So, after clicking “Detach” button at the top right corner, the chart will be separated in the new window. Then click the “Detach” button in the “Options” box at the bottom left corner in the new window. Another window will pop up again.

If you need to monitor more than one stock chart at the same time, you can “clone” the chart by clicking the “Clone” button, just next to the “Detach” button in the “Options” box. You can then arrange the charts (say, 4 charts) in such a way that they all can be shown in one screen.

Monday, June 4, 2007

How To Start A Real-time Streaming Chart in OptionsXpress

In the earlier post, I mentioned that if you open an account with OptionsXpress (OX), you can use their real-time streaming chart for free. Since I’m familiar with OX charts, for the benefit of the beginners or those who have just opened an account with OX and still not familiar with it, I’d like to share here the steps to start live streaming chart in OX, so that you can save some exploring time. Hope it can be useful. :)

Note:
You need to ensure that you’ve install (latest) Java software so that the streaming charts will work.

STEPS TO START THE JAVA STREAMING CHART IN OPTIONSXPRESS (OX):

1. Click: Quotes >> Chart >> Java Charts.
2. Wait for a while. Take some times for loading the chart.

3. After the chart is loaded, you can then select your chart setting:
a) Chart type: Candle, Bar, Line, etc.
b) Chart Window (Period of the chart): 1 day, 2 days, 1 mth, 3 mth, 6 mth, 1 year, etc.
c) Time frame: D (Daily), W (Weekly), M (Monthly), Q (Quarterly), Y (Yearly).


4. You can also set your chart options and select respectively in the “Options” box at the bottom left corner if you want: Log scale or normal scale, color the chart or just black & white, to hide / unhide studies or drawn item or volume.

5. To activate the real-time streamline chart, you need to tick the “Streaming Chart” in the “Options” box. Once it’s ticked, a new box appears in the top left corner below the stock ticker (“Symbol”), showing Last, Bid, Ask, Volume, etc. You will notice that these quotes and the price highlighted in black (at the left side) are moving during trading hours.

6. However, the candle (if you choose candle as your chart type) may not be adjusting the price movement as fast. You can refresh it by clicking “Go” near the box where you type the stock ticker (top left corner).

Update:
If you want the chart to stand by itself as a separate window, you can detach the chart.
You can also clone the charts, so that you can monitor a few stock charts simultaneously.
Read this post on how to detact & clone charts in OptionsXpress.

Friday, June 1, 2007

My Online Stock Option Brokers (Part 2)

Go to “Part 1”.

Interactive Brokers (IB):

  • Fewer steps for placing a trading order, and hence it’s faster in order placement procedure. Very good for those who are already familiar with trading order placement.

  • Fee and Charges for Options Transaction: USD 0.75 / contract.
    Minimum commission charges per order is USD 1.
    Hence, when you buy only 1 contract, they will charge you USD 1. And when you sell to close your position, they will charge you another USD 1.
    For more details, you can check out here.

  • Minimum initial deposit to open an account: USD 5,000.

  • For IB, after you apply for account opening, you need to get their approval first before you can open an account with them. After your application is approved, you can then proceed to fund the account. Please note that for IB, your account will get activated only after you fund the account.

  • Getting market data (real-time streaming quotes) is not automatic after your account is activated. To get real-time market data, you need to subscribe market data. The monthly subscription fee is USD 10, but it will be waived if your monthly commission is more than USD 30.

  • To do virtual trading in IB, you need to apply for it too. They will then open a virtual trading account with a different User ID and password, separated from your real trading account.

  • IB charges minimum monthly fee of USD 10. So, after your account is activated, although you have not subscribed for market data, they will still charge you USD 10. But when you subscribe for market data and suppose you don’t have any trades at all (so commission charges = 0), they will charge you only USD 10 too, which is for the market data subscription (not USD 20 which is for minimum monthly fee plus market data subscription.
    Therefore, I think, if you choose to use IB, you should open an account with them only after you are ready to start real trading.

  • When you make modification / cancellation for your order, they will charge you too. The charges will vary depending on exchanges. You can check here for more details.

Note:
I have no commercial affiliation with OptionsXpress (OX) or Interactive Brokers (IB). Nor am I recommending or promoting these brokers. Here, I’m only sharing with you my experience and what I know about the brokers I use. So, this is for informational purpose only. You should do your own research and comparison with the other brokers. Here is the list of some online stock options brokers.